Debug options
Debug: DEBUG OP overview
When developing or porting operators with AscendNPU IR (e.g. Triton frontend + AscendNPU IR compile/run), debugging is essential. AscendNPU IR provides two main debug ops at different abstraction levels:
HFusion
PrintOp: Used during graph compilation and fusion to print intermediate tensors and results.HIVM
DebugOp: Used at the lower HIVM level to print intermediate tensors and results.
This section describes these ops and how to use them, using the Triton frontend as an example.
AscendNPU IR debug ops
Printing relies on the Bisheng compiler’s cce::printf interface. To enable printing:
Enable the macro
__CCE_ENABLE_PRINT__(e.g. for Triton:export TRITON_DEVICE_PRINT=1).Build the AscendNPU IR meta op library with
--cce-enable-print(currently enabled by default).
HFusion: PrintOp
Interface
# hex: whether to print values in hex (default decimal)
# %0: tensor to print, 1D size 8, dtype=int64
hfusion.print " x: " {hex = xxx} %0 : tensor<8xi64>
Usage
You can insert PrintOp during HFusion passes or when building IR by hand. Example: to print the result of a load, add hfusion.print in the HFusion IR:
func.func @vector_kernel(%arg0: memref<?xi8> {hacc.arg_type = #hacc.arg_type<sync_block_lock>}, %arg1: memref<?xi8> {hacc.arg_type = #hacc.arg_type<workspace>}, %arg2: memref<?xi64> {tt.divisibility = 16 : i32, tt.tensor_kind = 0 : i32}, %arg3: i32, %arg4: i32, %arg5: i32, %arg6: i32, %arg7: i32, %arg8: i32, %arg9: i32) attributes {SyncBlockLockArgIdx = 0 : i64, WorkspaceArgIdx = 1 : i64, hacc.entry, hacc.function_kind = #hacc.function_kind<DEVICE>, mix_mode = "aiv", parallel_mode = "simd"} {
  %reinterpret_cast = memref.reinterpret_cast %arg2 to offset: [0], sizes: [8], strides: [1] : memref<?xi64> to memref<8xi64, strided<[1]>>
  %alloc = memref.alloc() : memref<8xi64>
  memref.copy %reinterpret_cast, %alloc : memref<8xi64, strided<[1]>> to memref<8xi64>
  %0 = bufferization.to_tensor %alloc restrict writable : memref<8xi64>
  hfusion.print " x: " {hex = false} %0 : tensor<8xi64>
  return
}
HIVM: DebugOp
Interface
# debugtype: "print" or "assert"
# hex: print in hex or decimal
# prefix: string printed before the value
# tcoretype: CUBE or VECTOR core
# %0: tensor to print, 1D size 8, dtype=int64
hivm.hir.debug {debugtype = "xxx", hex = xxx, prefix = " xxx: ", tcoretype = #hivm.tcore_type<xxx>} %0 : tensor<8xi64>
Usage
You can add DebugOp during HIVM passes or in hand-written HIVM IR. Example: to print the result of a load, add hivm.hir.debug in the HIVM IR:
func.func @vector_kernel(%arg0: i64 {hacc.arg_type = #hacc.arg_type<ffts_base_address>}, %arg1: memref<?xi8> {hacc.arg_type = #hacc.arg_type<sync_block_lock>}, %arg2: memref<?xi8> {hacc.arg_type = #hacc.arg_type<workspace>}, %arg3: memref<?xi64> {tt.divisibility = 16 : i32, tt.tensor_kind = 0 : i32}, %arg4: i32, %arg5: i32, %arg6: i32, %arg7: i32) attributes {SyncBlockLockArgIdx = 0 : i64, WorkspaceArgIdx = 1 : i64, func_dyn_memref_args = dense<[false, true, true, true, false, false, false, false]> : vector<8xi1>, hacc.entry, hacc.function_kind = #hacc.function_kind<DEVICE>, mix_mode = "aiv", parallel_mode = "simd"} {
  %0 = arith.muli %arg5, %arg6 : i32
  %1 = arith.muli %0, %arg7 : i32
  annotation.mark %1 {logical_block_num} : i32
  %reinterpret_cast = memref.reinterpret_cast %arg3 to offset: [0], sizes: [8], strides: [1] : memref<?xi64> to memref<8xi64, strided<[1]>>
  %alloc = memref.alloc() : memref<8xi64>
  hivm.hir.load ins(%reinterpret_cast : memref<8xi64, strided<[1]>>) outs(%alloc : memref<8xi64>) init_out_buffer = false may_implicit_transpose_with_last_axis = false
  %2 = bufferization.to_tensor %alloc restrict writable : memref<8xi64>
  hivm.hir.debug {debugtype = "print", hex = false, prefix = " x: ", tcoretype = #hivm.tcore_type<CUBE_OR_VECTOR>} %2 : tensor<8xi64>
  return
}
Triton integration
Multiple frontends integrate with AscendNPU IR; here we describe Triton. The other methods include TileLang, FlagTree, DLCompiler, and TLE, can also follow Triton’s pattern.
Triton debug-related ops:
static_assert: Compile-time assertion
static_print: Compile-time print
device_assert: Runtime device assertion
device_print: Runtime device print
static_assert
API
# condition: bool – compile-time constant boolean
# message: str – optional message when assertion fails
triton.language.static_assert(condition: bool, message: str = "") -> None
Example
You can verify the correctness of the functionality by running python3 <file>.py
import triton
import torch
import triton.language as tl

@triton.jit
def kernel_name(x_ptr, y_ptr, n_elements, BLOCK: tl.constexpr):
    tl.static_assert(BLOCK < 0, "BLOCK must > 0")
    pid = tl.program_id(0)
    offsets = pid * BLOCK + tl.arange(0, BLOCK)
    mask = offsets < n_elements
    x = tl.load(x_ptr + offsets, mask=mask)
    tl.store(y_ptr + offsets, x, mask=mask)

def vector(x, y):
    n = x.numel()
    grid = (triton.cdiv(n, 32),)
    kernel_name[grid](x, y, n, 32)

if __name__ == "__main__":
    x = torch.ones(8, device="npu")
    y = torch.empty_like(x)
    vector(x, y)
Assertion effect

static_print
API
# message: str – message to print; can include compile-time constants
triton.language.static_print(message: str) -> None
Example
You can verify the correctness of the functionality by running python3 <file>.py
import triton
import torch
import triton.language as tl

@triton.jit
def kernel_name(x_ptr, y_ptr, n_elements, BLOCK: tl.constexpr):
    tl.static_print(f" BLOCK = {BLOCK} ")
    pid = tl.program_id(0)
    offsets = pid * BLOCK + tl.arange(0, BLOCK)
    mask = offsets < n_elements
    x = tl.load(x_ptr + offsets, mask=mask)
    tl.store(y_ptr + offsets, x, mask=mask)

def vector(x, y):
    n = x.numel()
    grid = (triton.cdiv(n, 32),)
    kernel_name[grid](x, y, n, 32)

if __name__ == "__main__":
    x = torch.ones(8, device="npu")
    y = torch.empty_like(x)
    vector(x, y)
Print effect

device_assert
Note: set export TRITON_DEBUG=1 and export TRITON_DEVICE_PRINT=1 before use.
API
# condition: bool – condition to assert (must be a boolean tensor)
# message: str – optional message on failure
triton.language.device_assert(condition: bool, message: str = "") -> None
Example
You can verify the correctness of the functionality by running python3 <file>.py
import triton
import torch
import triton.language as tl

@triton.jit
def assert_kernel(x_ptr, y_ptr, n_elements, BLOCK: tl.constexpr):
    pid = tl.program_id(0)
    offsets = pid * BLOCK + tl.arange(0, BLOCK)
    mask = offsets < n_elements
    x = tl.load(x_ptr + offsets, mask=mask)
    tl.device_assert(x > 0, "Input values must be positive!")
    tl.store(y_ptr + offsets, x, mask=mask)

def test_assert():
    x_valid = torch.tensor([1.0, 2.0, 3.0, 4.0], device="npu")
    y = torch.empty_like(x_valid)

    grid = (triton.cdiv(x_valid.numel(), 4),)
    assert_kernel[grid](x_valid, y, x_valid.numel(), 4)

    x_invalid = torch.tensor([1.0, -2.0, 3.0, 4.0], device="npu")
    assert_kernel[grid](x_invalid, y, x_invalid.numel(), 4)

if __name__ == "__main__":
    test_assert()
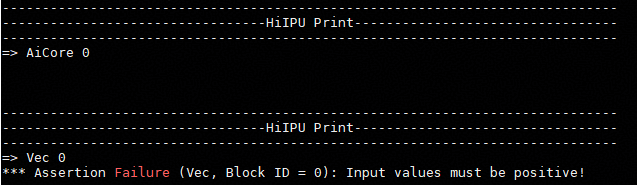
Assertion effect
device_print
Note: set export TRITON_DEVICE_PRINT=1 before use.
API
# prefix: str – string printed before the value(s)
# *args – tensors or scalars to print
# hex: bool – print in hex (default False)
triton.language.device_print(prefix, *args, hex=False) -> None
Example
You can verify the correctness of the functionality by running python3 <file>.py
import triton
import torch
import triton.language as tl

@triton.jit
def print_kernel(x_ptr, y_ptr, n_elements, BLOCK: tl.constexpr):
    pid = tl.program_id(0)
    offsets = pid * BLOCK + tl.arange(0, BLOCK)
    mask = offsets < n_elements
    x = tl.load(x_ptr + offsets, mask=mask)
    tl.device_print("x = ", x)
    tl.store(y_ptr + offsets, x, mask=mask)

def test_print():
    x_valid = torch.tensor([1.0, 2.0, 3.0, 4.0], device="npu")
    y = torch.empty_like(x_valid)

    grid = (triton.cdiv(x_valid.numel(), 4),)
    print_kernel[grid](x_valid, y, x_valid.numel(), 4)

if __name__ == "__main__":
    test_print()
Print effect

Debug: tools
mssanitizer
Command-line tool for Triton kernel memory errors, race conditions, and uninitialized access. Set export TRITON_ENABLE_SANITIZER=true before use.
Usage
# Run your Triton kernel as usual
mssanitizer python test.py
Example
The following Triton add example uses an incorrect offsets calculation to show mssanitizer detection:
import torch
import triton
import triton.language as tl

@triton.jit
def add_kernel(
    x_ptr,
    y_ptr,
    output_ptr,
    n_elements,
    BLOCK_SIZE: tl.constexpr,
):
    pid = tl.program_id(axis=0)
    block_start = pid * BLOCK_SIZE
    offsets = block_start + tl.arange(0, BLOCK_SIZE) - 10
    mask = offsets < n_elements
    x = tl.load(x_ptr + offsets, mask=mask)
    y = tl.load(y_ptr + offsets, mask=mask)
    output = x + y
    tl.store(output_ptr + offsets, output, mask=mask)

def add(x, y):
    output = torch.empty_like(x)
    n_elements = output.numel()
    BLOCK_SIZE = 1024
    grid = (triton.cdiv(n_elements, BLOCK_SIZE),)
    add_kernel[grid](
        x, y, output,
        n_elements,
        BLOCK_SIZE=BLOCK_SIZE
    )

    return output

if __name__ == "__main__":
    size = 1024
    x = torch.rand(size, device='npu:0')
    y = torch.rand(size, device='npu:0')
    output_triton = add(x, y)
Running mssanitizer python3 test_add.py produces console output where mssanitizer reports a GM out-of-bounds read at the tl.load node (e.g. 40 bytes for 10 * float32).

For more on mssanitizer, see MindStudio operator development tools.
msprof
Command-line profiling tool for Triton kernel performance collection and analysis.
Usage
# Full-network on-device profiling
# --output: directory for profiling data (default: current dir)
# --application: command to run
msprof --output=xxx --application=""

# Single-operator on-device profiling
# --kernel-name: kernel name (supports prefix match)
# --aic-metrics: enable metrics (Roofline, Occupancy, MemoryDetail, etc.)
msprof op --output=xxx --application="" --kernel-name=xxx --aic-metrics=xxx

# Single-operator simulator profiling
# --core-id: logical core id(s) to profile
# --soc-version: simulator type (e.g. Ascend910B4)
msprof op simulator --core-id=xxx --kernel-name=xxx --soc-version=Ascendxxx --output=xxx
Common performance analysis outputs
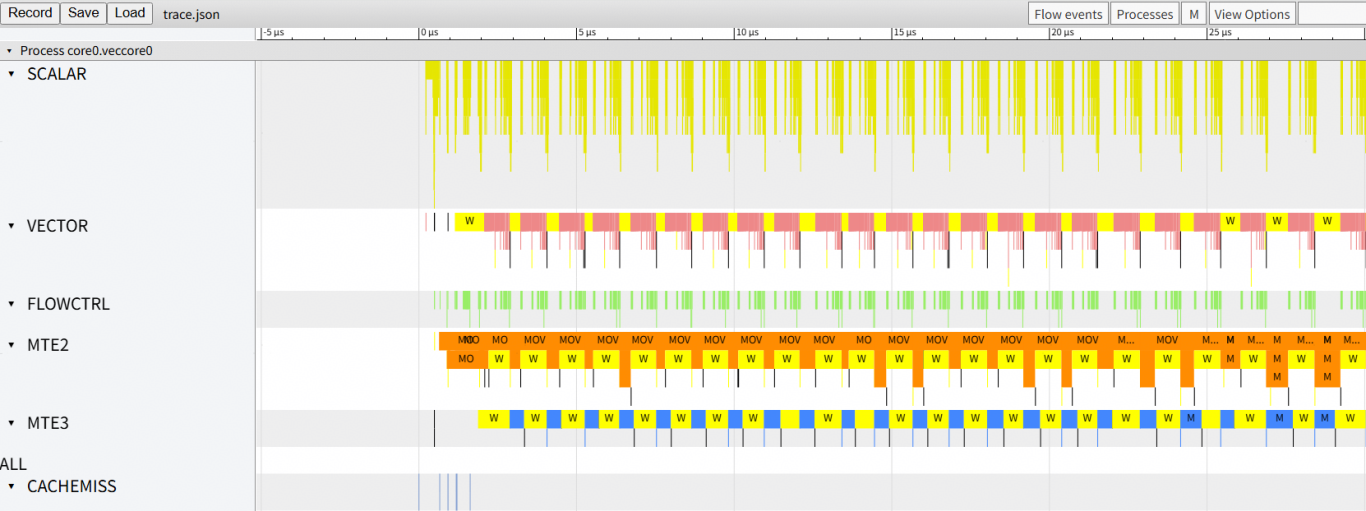
trace.json: Open in chrome://tracing/ for instruction pipeline view.
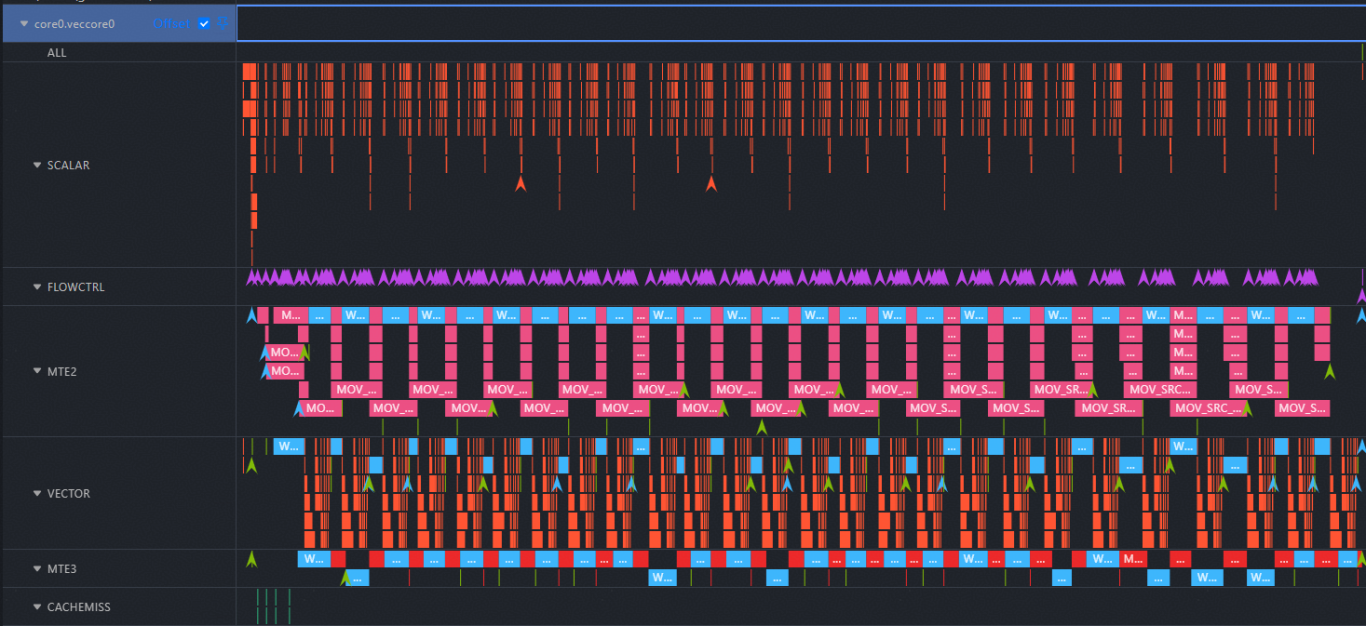
visualize_data.bin: Open in Mind Studio Insight to visualize instruction execution on the Ascend AI processor.
For more analysis options, see MindStudio operator development tools.
Triton kernel pipeline collection
Using the following add kernel as an example to collect pipeline data:
import torch
import triton
import triton.language as tl

@triton.jit
def add_kernel(
    x_ptr,
    y_ptr,
    output_ptr,
    n_elements,
    BLOCK_SIZE: tl.constexpr,
):
    pid = tl.program_id(axis=0)
    block_start = pid * BLOCK_SIZE
    offsets = block_start + tl.arange(0, BLOCK_SIZE)
    mask = offsets < n_elements
    x = tl.load(x_ptr + offsets, mask=mask)
    y = tl.load(y_ptr + offsets, mask=mask)
    output = x + y
    tl.store(output_ptr + offsets, output, mask=mask)

def add(x, y):
    output = torch.empty_like(x)
    n_elements = output.numel()
    BLOCK_SIZE = 1024
    grid = (triton.cdiv(n_elements, BLOCK_SIZE),)
    add_kernel[grid](
        x, y, output,
        n_elements,
        BLOCK_SIZE=BLOCK_SIZE
    )

    return output

if __name__ == "__main__":
    size = 1024
    x = torch.rand(size, device='npu:0')
    y = torch.rand(size, device='npu:0')
    output_triton = add(x, y)
Run:
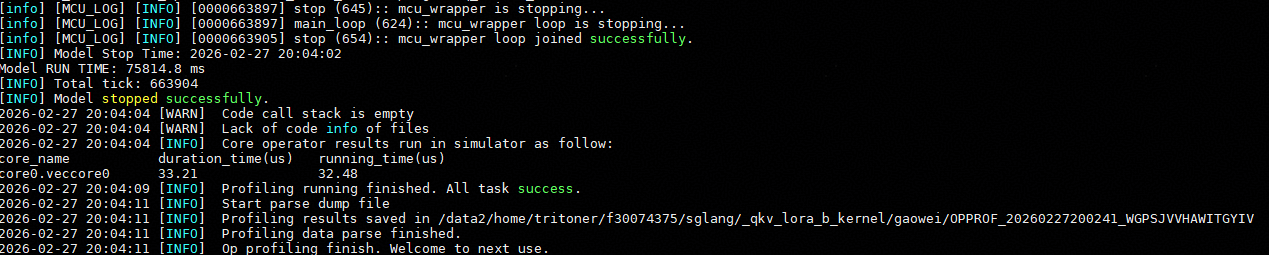
msprof op simulator --kernel-name="add_kernel" --soc-version=Ascend910B4 --core-id=0 --output=./ python3 test_add.py
This creates an OPPROF with a timestamp directory in the current path.
Open the simulator/visualize_data.bin file in Mind Studio Insight to view the pipeline for the selected core (e.g. core 0), the two types of commonly used performance pipeline diagrams (trace.json/visualize_data.bin) described earlier can both be found in the ./OPPROF_<Timestamp>/simulator directory.